
UK emission targets (original page from 2011)
The UK has lead the world by setting strong greenhouse gas reduction targets. Emissions since the 1990 baseline are shown to be encouraging: we have already exceeded our Kyoto Protocol target, by twice as much as the required 12.5%. The cuts have been most effective in gases like methane and nitrous oxide. Carbon dioxide emissions have reduced by one-tenth but we now have a big challenge to bring this down to meet our mid-century targets.
There are currently 3 binding targets for UK emissions reduction:
- the Kyoto Protocol, which gives us an internationally agreed target of a 12.5% cut by 2012
![[i]](../images/_info.jpg "Under the Kyoto Protocol, the European Union and its Member States have agreed to meet a joint target of a an 8 per cent reduction in greenhouse gas emissions below 1990 levels by 2012. This 'bubble' arrangement allows the EU's target to be redistributed between member states to reflect their national circumstances, requirements for economic growth, and the scope for further emission reductions. The UK agreed to a 12.5% cut as part of this.") ;
; - an 80% cut by 2050, which was made law in the Climate Change Act 2008;
- and an "interim target", of a 34% cut by 2020, which was made legally binding in the April 2009 Budget.
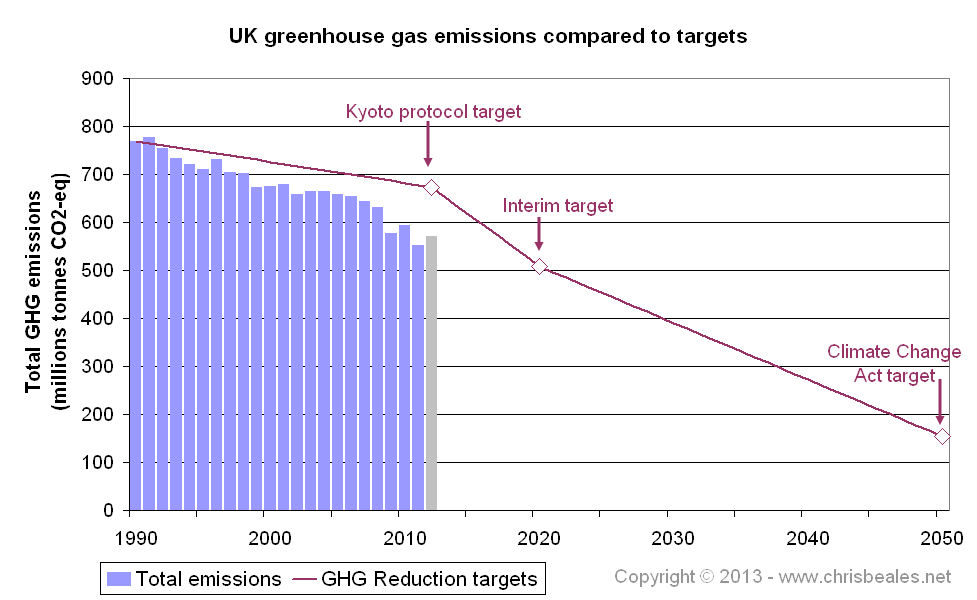
The target emission cuts are all compared against our emissions in 1990 - the "baseline year". The cuts are against our emissions of a selection of greenhouse gases (GHGs), as discussed in the next section: these include carbon dioxide (CO2), methane and nitrous oxide. The following graph shows our how our recent emissions compare against these targets. Notice that:
- Our 1990 baseline was equivalent to 778 million tonnes of carbon dioxide (778 Mt CO2-eq).
- We have already met our Kyoto targets, in fact we exceeded the 12.5% cut in the year 2000 (12 years early).
- By 2008 we had cut emissions by 20% to 620 Mt CO2-eq.
- 2009 emissions were down to 566 Mt CO2-eq, the sharp fall being attributed to the economic recession.
- Provisional figures for 2010 (in gray) bring emissions up by 2.8% to 582 Mt CO2-eq. DECC has attributed this principally to an increase in residential gas use - a consequence of the cold winter - and switching away from nuclear to coal for electricity generation.
- It is worth noting that there is a continuous process of improvement the estimates of our emissions data, hence the dataset is revised every year. An updated version of the graph, with provisional data for 2012, is here. This was used in the Zero Carbon Britain report.

The UK emissions data (1990-2010) are sourced from NAEI (the National Atmospheric Emissions Inventory), which now reports statistics to DECC (the Department of Energy and Climate Change).
Our greenhouse gas "basket"
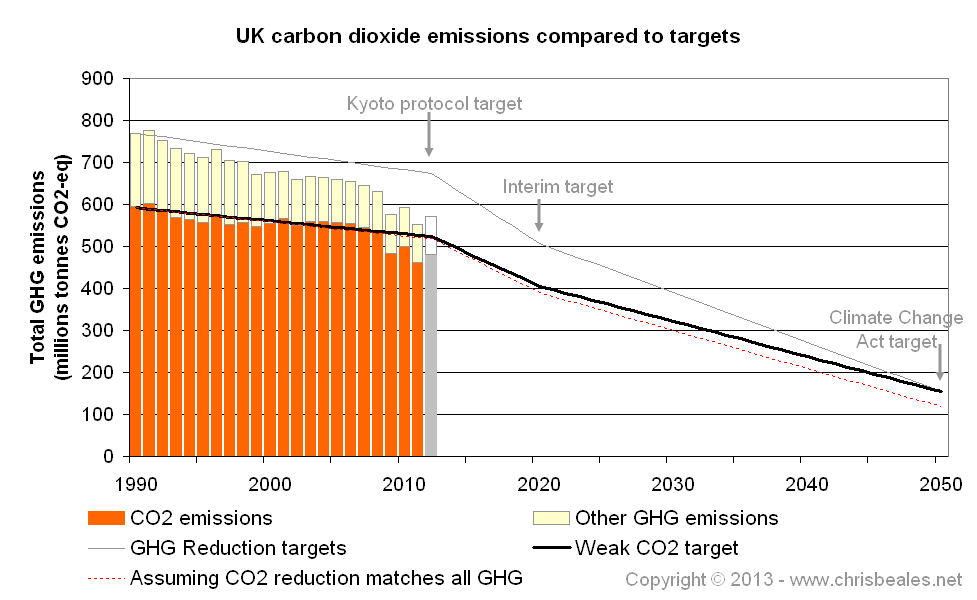
The Kyoto Protocol identified a "basket" of six greenhouse gases, considered to be the most potent and prolific. The following graph shows how these are split in UK emissions.
- Notice that all greenhouse gases are already converted into "CO2 equivalent" (e.g. methane is 21 times more potent than CO2 so the actual emissions of 5 million tonnes in 1990 is equivalent to 105 million tonnes CO2).
- Even taking these factors into account, you can see that CO2 is by far the biggest contributor to our emissions. In 2008 it accounted for 85% of our greenhouse gas emissions.
- Since 1990, CO2 emissions have reduced by 11% (by 64 Mt CO2-eq). The emissions equivalent for all the other gases (particularly methane and nitrous oxide) was cut by over 48% (by 99 Mt CO2-eq). In fact the reduction in emissions of these other gases was approximately 60% of our total GHG emissions reduction to 2008.
 agreements.")
What does this mean for UK CO2 targets?
If we reduced the other gases down to zero emissions, we would be allowed to emit more CO2 and still meet our Climate Change Act 80% emissions reduction target. However, there is not much room for manoeuvre, as CO2 is such a dominant part of or greenhouse gas basket.
- In the 1990 baseline year, CO2 accounted for 76% of total UK GHG emissions (590 Mt CO2-eq). The other gases accounted for 192 Mt CO2-eq.
- In 2050 our total emissions target is 156 Mt CO2-eq. If this was all carbon dioxide, it would be equivalent to a weak target of a 74% cut in CO2 levels compared to 1990.
- It is clear to see that we really must focus hard on reducing CO2 as soon as possible.
- An updated version of the graph with povisional figures up to 2012, which you can see here.

.jpg "link back to emissions targets page")
Return to main Emissions Targets page
![[css]](http://jigsaw.w3.org/css-validator/images/vcss-blue "link to W3C validation website, which will show that the stylesheets are Valid CSS")
![[info]](../images/btn_info.jpg "link to information about this website")
![[top]](../images/btn_top.jpg "jump up to the top of this page")